Image

Archive for Uncategorized

Foreclosure Activity Down in California

 Foreclosure Activity Down in California

Following promising reports of increased sales in California’s Southland Empire, analytics company DataQuick issued another release revealing that foreclosure activity is down in the state.

According to the company’s data, the number of California homes entering the formal foreclosure process dropped in the year’s second quarter to its lowest level since early 2007.

During the period between April-June, a total of 54,615 Notices of Default (NODs) were recorded on houses and condos, a 2.9 percent decrease from the first quarter and a 3.6 percent decrease from the same period in 2011. This total is the lowest since second-quarter 2007, which saw 53,943 NODs.

The most noticeable year-over-year drop was in the Bay Area, which saw a 13.4 percent drop in NODs from 2011.

The fall in activity is attributed to several factors, including an improved housing market, growth in short sale activity, and the falling number of egregious mortgages originated between 2005-2007.

However, DataQuick president John Walsh said that the decrease in foreclosure activity could just be a brief lull.

“The foreclosure process has always been the sanitation department of the housing sector. It’s where financial distress is processed. The question is whether these lower NOD numbers mean that there’s less distress to process, or if we’re just seeing distress get processed at a slower pace,” said Walsh.

According to DataQuick, most of the loans going into default are from the 2005-2007 period. The median origination quarter for defaulted loans is third-quarter 2006 for the third straight year, indicating a peak in weak underwriting standards at that time.

DataQuick’s findings showed that mortgage defaults tended to remain concentrated in the state’s most affordable neighborhoods. Zip codes with median sales prices of $200,000 or less had a ratio of nearly nine NODs filed for every 1,000 homes, while zip codes priced between $200,000 and $800,000 had a ratio of 5.6 NODs filed per 1,000 homes.

In the state’s larger counties, mortgages were least likely to go into default in San Francisco, Marin, and San Mateo counties. Tulare, San Joaquin, and Sacramento counties had the highest probability of foreclosure.

As the economy slowly regains its strength, Walsh said the housing market may start looking to other options to avoid foreclosure activity.

“Obviously the economy has been on the mend – however slowly. But because housing is widely seen by economists as the biggest drag on growth, some interesting alternatives to the foreclosure process are being discussed, such as the use of eminent domain to buy and restructure mortgages. Needless to say, we’re all watching closely,” he said.

Article courtesy of DsNews.com

Real Estate Outlook: Existing-Home Sales Rise Again

Real Estate Outlook: Existing-Home Sales Rise Again


The National Association of Realtors latest existing-home sales survey shows that sales are on the rise again. This is the third straight month of increases as well the rate rising above year ago levels. December saw a 5.0 percent rise and is now 3.6 percent above December 2010. The entire of year of 2011 experienced an overall 1.7 percent rise in existing-home sales over 2010.

Lawrence Yun, NAR chief economist, said these are early signs of what may be a sustained recovery. “The pattern of home sales in recent months demonstrates a market in recovery,” he said. “Record low mortgage interest rates, job growth and bargain home prices are giving more consumers the confidence they need to enter the market.”

Regional increases were seen across the board, but had the largest increase in the Northeast which rose by 10.7 percent for the month of December. Next in line was the Midwest, rising 8.3 percent. The South and west followed suite, rising 2.9 and 2.6 percent respectively.

This rise in existing-home sales has led to a dip in available inventory, which is welcome news for many sellers who are facing steep competition. NAR reports “available inventory has trended down since setting a record of 4.04 million in July 2007, and is at the lowest level since March 2005 when there were 2.30 million homes on the market.”

Total housing inventory fell a staggering 9.2 percent in December to 2.38 million homes for sale. “The inventory supply suggests many markets will see prices stabilize or grow moderately in the near future,” Yun said.

NAR President Moe Viessi, broker-owner of Veissi & Associates Inc., in Miami, said more buyers are expected to take advantage of market conditions this year. “The American dream of homeownership is alive and well. We have a large pent-up demand, and household formation is likely to return to normal as the job market steadily improves,” he said. “More buyers coming into the market mean additional benefits for the overall economy. When people buy homes, they stimulate a lot of related goods and services.”

Partially to blame for pent up demand has been the large amount of contract failures. The NAR says failures were reported by 33 percent of NAR members in December, unchanged from November; they were 9 percent in December 2010.

Declined mortgages and depressed home values leading to loan values under appraised values are heavily at fault. A recent Government Accountability Office (GOA) found that the appraisal process needs more monitoring procedures.

A recent NAHB survey shows that one out three builders have lost signed sales contracts because of flawed appraisals.

NAHB Chairman Bob Nielsen says, “The current system is not working.” He called for resolution of a flawed appraisal process. He says the current system “fosters price instability, puts more families in danger of default or foreclosure, and undermines the housing and economic recovery.”

Published: January 30, 2012 By Realty Times
Written By: Carla Hill

Pending home sales continued to rise in November

Pending home sales continued to rise in November, reaching their highest level in 19 months, the National Association of Realtors (NAR) reported late last week.

The trade group’s index of signed sales contracts jumped 7.3 percent between October and November and is 5.9 percent above its level a year earlier. The last time the index was higher was in April 2010 as buyers rushed to beat the deadline for the homebuyer tax credit.

James Frischling, president and co-founder of NewOak Capital, says the latest results are likely to feed the view that there is a recovery going on in the housing market.

“This was an unexpected jump-up, with every region showing gains including a 15 percent increase out west, which has been the hardest hit area since the housing bubble burst,” Frischling noted.

Despite the strong gains atypical of the season, Frischling remains cautious. He says with contract cancellations above 30 percent, Realtors are keenly aware that it’s premature to conclude a housing recovery is underway based on November’s strong pending sales report.

Lawrence Yun, NAR’s chief economist, agrees that contract failures have been running unusually high.

“Some of the increase in pending home sales appears to be from buyers recommitting after an initial contract ran into problems, often with the mortgage,” he said.

Still, Yun described November sales activity as “doing reasonably well in comparison with the past year.”

“The sustained rise in contract activity suggests that closed existing-home sales, which are the important final economic impact figures, should continue to improve in the months ahead,” Yun added.

According to Frischling, the overarching question is whether there are a sufficient number of buyers to absorb the supply of homes which will inevitably hit the market.

With the foreclosure pipeline still growing and over 6 million borrowers behind on their mortgage payments, he says the inventory of homes available for sale will continue to build up, putting downward pressure on home prices and holding back any meaningful recovery.

“Yet with the rental market on fire, an improving jobs picture, and with interest rates being so low, the spike in contracts signed was a welcomed way to finish the year,” Frischling said. “The follow-through on these pending home sales will tell whether the positive factors facing the housing market outweigh the negative and if this market has finally turned the corner.”

NAR acknowledged last month that it over-estimated actual sales closings for existing homes, going back to 2007. The trade group has adjusted sales and inventory figures for the last four years downward by 14.3 percent, citing discrepancies between sales reported by multiple listing services (MLSs) and sales included in its U.S. Census benchmark.

Pending home sales, however, are not affected by the recently published re-benchmarking of existing-home sales, according to NAR, namely because the pending sales index uses a different methodology based directly on contract signings and is adjusted for seasonality.

Article courtesy of: DSNews.com

It’s Time to Buy That House

It’s Time to Buy That House

U.S. house prices have plunged by nearly a third since 2006, and homeownership rates are falling at the fastest pace since the Great Depression.

The good news? Two key measures now suggest it’s an excellent time to buy a house, either to live in for the long term or for investment income (but not for a quick flip). First, the nation’s ratio of house prices to yearly rents is nearly restored to its prebubble average. Second, when mortgage rates are taken into consideration, houses are the most affordable they have been in decades.

Two of the silliest mantras during the real-estate bubble were that a house is the best investment you will ever make and that a renter “throws money down the drain.” Whether buying is a better deal than renting isn’t a stagnant fact but a changing condition that depends on the relationship between prices and rents, the cost of financing and other factors.
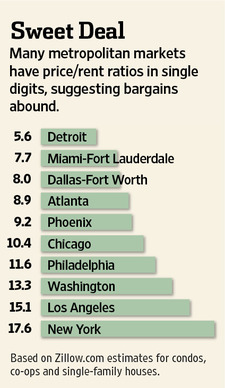
But the math is turning in buyers’ favor. Stock-oriented folks can think of a house’s price/rent ratio as akin to a stock’s price/earnings ratio, in that it compares the cost of an asset with the money the asset is capable of generating. For investors, a lower ratio suggests more income for the price. For prospective homeowners, a lower ratio makes owning more attractive than renting, all else equal.

Nationwide, the ratio of home prices to yearly rents is 11.3, down from 18.5 at the peak of the bubble, according to Moody’s Analytics. The average from 1989 to 2003 was about 10, so valuations aren’t quite back to normal.

But for most home buyers, mortgage rates are a key determinant of their total costs. Rates are so low now that houses in many markets look like bargains, even if price/rent ratios aren’t hitting new lows. The 30-year mortgage rate rose to 4.12% this week from a record low of 3.94% last week, Freddie Mac said Thursday. (The rates assume 0.8% in prepaid interest, or “points.”) The latest rate is still less than half the average since 1971.

As a result, house payments are more affordable than they have been in decades. The National Association of Realtors Housing Affordability Index hit 183.7 in August, near its record high in data going back to 1970. The index’s historic average is roughly 120. A reading of 100 would mean that a median-income family with a 20% down payment can afford a mortgage on a median-price home. So today’s buyers can afford handsome houses—but prudent ones might opt for moderate houses with skimpy payments.

For example, the median home in the greater Phoenix market, including houses, condos and co-ops, costs $121,700, according to Zillow.com. With a 20% down payment and a 4.12% mortgage rate, a buyer’s monthly payment would be about $470. Rent for a comparable house would be more than $1,100 a month, according to data provided by Zillow.com.

Of course, all of this assumes mortgages are available—no given now that lending standards have tightened. But long-term data on down payments and credit scores suggest conditions are more normal than many buyers think, according to Stan Humphries, chief economist at Zillow. “If you have good credit, a job and a down payment, you can get a mortgage,” Mr. Humphries says. “There’s more paperwork and scrutiny than five years ago, but things are pretty much like they were in the ’80s and ’90s.”

Not all housing markets are bargains. Mr. Humphries says Zillow has developed a new price/rent ratio that uses estimates for each individual property rather than city medians, to better reflect the choices facing typical buyers. A fresh look at the numbers suggests Detroit and Miami are plenty cheap for buyers, with price/rent ratios of 5.6 and 7.7, respectively. New York and San Francisco are more expensive, with ratios of 17.6 and 17.2, respectively. The median ratio for 169 markets is 10.7.

For investors seeking income, one back-of-the-envelope way of seeing how these numbers stack up against yields for other assets is to divide 1 by the price/rent ratio, resulting in a rent “yield.” The median market’s rent yield is 9.3% and Detroit’s is 17.9%.

Investors would then subtract for taxes, insurance, upkeep and other expenses—costs that vary widely. But suppose total costs were 4% of the purchase price. That would still leave a 5.3% rent yield in the typical market. With the 10-year Treasury yield at 2.2% and the Standard & Poor’s 500-stock index carrying a dividend yield of 2.1%, rents for residential housing in many markets look attractive.

A few caveats are in order. First, not all transactions are average ones. Even in low-priced markets, buyers should shop carefully. Second, prices could fall further. Celia Chen, a senior director at Moody’s Analytics, expects prices to drop 3% before bottoming early next year and rising slowly thereafter. “If the economy slips back into recession, however, we could easily see a 10% drop,” Ms. Chen says.

And property “flipping” can be dangerous even when prices are rising. That is because, absent a real-estate boom, house price gains simply aren’t that exciting. Research by Yale economist Robert Shiller suggests houses more or less track the rate of inflation over long time periods.

Houses aren’t the magic wealth creators they were made out to be during the bubble. But when prices are low, loans are cheap and plump investment yields are scarce, buyers should jump.

Resource: http://WallStreetJournal   Written by: Jack Hough at SmartMoney.com.

Energy Tax Credit Facts

Energy Tax Credit Facts

Buyers and contractors alike are looking for new ways to incorporate green technology into homes. Not only do these upgrades save money in the long run, but they also go a long ways in preserving Mother Earth.

Have you heard about the government’s “green” homeowners’ incentives? Take a moment to see how you can upgrade your home and get money back!

There are two basic tax credits available for those interested in making energy efficient improvements to their homes.

First, the Wind, Solar, Geothermal and Fuel Cell Tax Credit. It’s good for both existing homes and new construction, when used for a homeowner’s principal residence.

Homeowners will received a credit totaling 30 percent of their cost for improvements put into service between January 1, 2011 and December 31, 2011.

Here’s a list of what can qualify:

*  Geothermal Heat Pumps
*  Solar Panels
*  Solar Water Heaters
*  Small Wind Energy Systems
*  Fuel Cells (on this item the credit may not exceed $500 for each 0.5 kilowatt capacity; other limits apply in the case of joint occupancy)

The second notable credit is for Qualified Energy Efficiency Improvements, which gives a 10 percent credit for purchases that were “placed in service” this year.

This particular credit does have a limit, with “the maximum credit for a taxpayer for all taxable years being $500, and no more than $200 of such credit may be attributable to expenditures on windows. This rule means that taxpayers who have claimed $500 or more of this tax credit in prior years, particularly 2009 and 2010, can no longer participate in the program.” (NAHB)

Let’s take a look at what qualifies, according to the National Association of Home Builders an item qualifies if it:

*  meets or exceeds the prescriptive criteria for such a component established by the 2009 International Energy Conservation Code as such Code (including supplements) (or, in the case of windows, skylights and doors, and metal roofs with appropriate pigmented coatings or asphalt roofs with appropriate cooling granules, meets the Energy Star program requirements);
*  is installed in or on a dwelling located in the United States and owned and used by the taxpayer as the taxpayer’s principal residence;
*  the original use of which commences with the taxpayer; and
*  that reasonably can be expected to remain in use for at least five years.

These items can include building envelope components, insulation materials or systems, exterior windows, skylights, doors, storm windows and storm doors, metal or asphalt roofs, advanced main air circulating fans, and qualified natural gas, propane, or oil furnaces or hot water boilers.

Perhaps most important is how one goes about filing these claims. First, keep every single receipt, along with make, manufacturer, and model number on items. You can file these credits alongside your taxes using Form 5695. If you have lots of credits and deductions to take, it might be wise to enlist the help of a tax professional. Also check out http://energystar.gov/taxcredits for more information!

Written by Carla Hill